TL;DR
A flamegraph answers a single question: where does the CPU spend its time?
Once the plateau is located, the flamegraph won’t tell you what to do: the data model decides. An independent computation parallelizes; a single writer serializes. The flamegraph finds the cost, the architecture decides whether you can split it.
The code for this article is available on GitHub.
When a program is slow, the reflex is to reread the code “that looks slow” and optimize on instinct.
That’s almost always wasted time: intuition can aim at the wrong target, and you end up complicating code that didn’t need it…
The rule is to measure first and compare afterwards.
The flamegraph is the tool that answers one precise question and one only: which functions is the CPU spending its time in?
This article explains how to read a flamegraph, what it does not say, and how to decide what to do.
The examples are in Rust, but the method applies to any compiled language.
We’ll work with csv-report, a simple Rust tool (code on GitHub).
It walks a directory of CSV files, parses each line, aggregates statistics (average, min, max per column) and prints a report. Simple code, but enough to surface real performance problems.
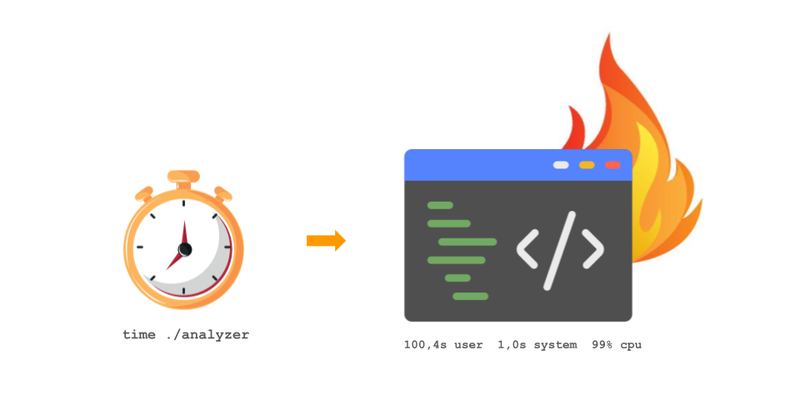
Before reaching for a profiler, a quick check with time.
csv-report reads its files locally (./data/) and the output is unambiguous:
$ time csv-report ./data/
csv-report  100.4s user  1.0s system  99% cpu  1:41.8 total
Here total (1 min 41.8 s) is the real wall-clock time elapsed, what we call real.
user and system are the CPU time spent in application code and in the kernel, respectively.
user + system ≈ real and 99% CPU: the program spends nearly all its time computing. The limiting factor is the CPU and a flamegraph will make sense.
It’s important to check this, because time can mean the opposite.
Imagine a variant of this same tool that downloads each CSV over the network (an S3 bucket or an API, say) before parsing it:
$ time csv-report-remote s3://bucket/data/
csv-report  1.6s user  0.7s system  11% cpu  21.4s total
The classic trap: 21 seconds total, but only 2.3 s of CPU (11%).
The program didn’t compute during the remaining ~19 s, it waited on the network.
If
user + systemis far belowreal, the bottleneck isn’t the CPU but waiting (network, disk, locks…). A CPU flamegraph will then be nearly empty, or worse, misleading.
flowchart LR
    T["time"] --> Q{"user+system ≈ real ?"}
    Q -->|yes| F["CPU flamegraph<br>relevant"]
    Q -->|no| W["look for what's waiting<br>I/O · network · locks"]

    style F fill:#e8f5e9,stroke:#388e3c
style W fill:#fce4ec,stroke:#c62828A flamegraph is produced by sampling: a sampler interrupts the program ~1,000 times per second and records the full call stack. Identical stacks are merged and stacked into rectangles.
Hence the following vocabulary:
- a box (the rectangle) represents a function;
- boxes stacked vertically form a call stack (each function above the one that called it);
- a wide, flat box at the top is a plateau: the function spends time there without calling anything further.

Click the image for the interactive version (zoom on click)
How do you read it?
- The vertical axis is who calls whom. At the very bottom,
main; each box above is a function called by the one below it. The higher you go, the deeper you are in the call stack. - The horizontal axis is NOT time. A flamegraph is not read left to right like a timeline: boxes are ordered alphabetically, not by execution order. A box’s position therefore means nothing; only its width counts.
- Width is cost. The wider a box, the more often the function appeared in the samples, so the more CPU it consumed. It’s the only metric to look at.
- What you’re looking for: wide plateaus at the top. A wide box at the very top of a stack is a function that consumes time without calling anything else: that’s where the work actually happens and therefore the first target to optimize.
For boxes to carry function names instead of hexadecimal addresses, you need a binary optimized with debug symbols.
In Rust, a classic release profile strips these symbols (the binary is stripped).
Hence a dedicated profile in Cargo.toml:
[profile.bench]
inherits = "release"
debug = true
Then cargo-flamegraph automates the capture:
cargo flamegraph --profile bench --bin slow -- ./data/It generates an interactive flamegraph.svg: you can zoom into each box by clicking.
Under the hood, the capture relies on
perf(Linux) orxctrace, the command-line tool of Instruments shipped with Xcode (macOS);dtraceis still usable but requiressudo.
The method is identical, the tools differ:
- Go:
go tool pprofproduces flamegraphs directly. The Go runtime instruments goroutines natively. - Python:
py-spysamples without modifying the code or restarting the process. - Node.js / TypeScript:
node --prof+node --prof-process, or0xfor a flamegraph in one command. - Java / JVM:
async-profiler. Naive profilers on the JVM oversample safe-points and bias the results: prefer a wall-clock profiler.
Click the image for the interactive version (zoom on click)
The flamegraph is the one for csv-report in its slow version (50 files × 100,000 lines).
The plateau is immediate: slow::process_file takes nearly all the time and most of it descends into regex::regex::string::Regex::new, then into regex_automata::meta::regex::Builder::build.
It isn’t the parsing itself that’s slow, it’s the regex compilation called once per line.
Here’s the slow version of parse_csv_line:
fn parse_csv_line(line: &str) -> Vec<f64> {
    // Regex recompiled on every call — the bottleneck.
    let re = Regex::new(r"[^,]+").unwrap();
    re.find_iter(line)
        .filter_map(|m| m.as_str().trim().parse::<f64>().ok())
        .collect()
}
On reading, nothing seems critical. The regex is simple, the logic correct.
But Regex::new compiles on every call.
Over 50 files × 100,000 lines, that’s 5 million compilations of a regex that never changes.
The flamegraph makes the problem visible in a second.
The fix is two lines:
fn parse_csv_line(line: &str) -> impl Iterator<Item = f64> + '_ {
    // Direct split: no automaton, no per-line allocation.
    line.split(',').filter_map(|s| s.trim().parse::<f64>().ok())
}
And the result measured over 50 files × 100,000 lines:
$ time ./slow ./data/
./slow  100.4s user  1.0s system  99% cpu  1:41.8 total

$ time ./mid ./data/
./mid    0.6s user  0.0s system  93% cpu  0.6s total
~155× on the same workload for three lines changed.
Identical output, byte for byte.
And all of this while staying single-threaded: we haven’t parallelized anything yet.
A new flamegraph confirms that the regex-compilation plateau is gone:

Click the image for the interactive version (zoom on click)
The work now concentrates in process_file:
- float parsing:
from_str,parse_number; - line splitting:
split→CharSearcher.
A single thread: the bar at the very bottom is main-thread.
Once parse_csv_line is fixed, a second plateau might emerge: the loop over the files is sequential.
That’s the tempting mistake: “wide plateau → I parallelize.”
But a wide plateau only says that CPU time is being spent there.
It doesn’t say whether that work is splittable.
In csv-report, each CSV file is parsed and aggregated independently of the others: no data shared between files and no imposed order.
This is the textbook case for parallelization: you can distribute the files across several threads without worrying about synchronization.
In Rust, rayon distributes the work across all cores with a par_iter:
use rayon::prelude::*;

// Before: sequential
let all_stats: Vec<Vec<Stats>> = entries.iter().map(|e| process_file(&e.path())).collect();

// After: one word changed
let all_stats: Vec<Vec<Stats>> = entries.par_iter().map(|e| process_file(&e.path())).collect();
The flamegraph of the fast version with par_iter shows a radically different profile.

Click the image for the interactive version (zoom on click)
The contrast is sharp: the stack fans out across rayon threads (rayon::iter::plumbing::bridge_producer_consumer::helper, rayon_core::join::join_context) and the business functions (parse_csv_line, aggregate_stats) appear in parallel on each worker.
The single plateau of the single-threaded version is replaced by N simultaneous plateaus.
$ time ./mid ./data/
./mid    0.6s user  0.0s system  93% cpu  0.6s total

$ time ./fast ./data/
./fast   0.7s user  0.0s system  655% cpu  0.1s total
~6× additional gain just by replacing iter() with par_iter() (on a multi-core machine).
The gain also shows in the CPU figure: 93% (one saturated core) versus 655% (several cores in parallel).
Non-splittable plateau. If the work shared mutable state (an output file open for writing, a database connection, a global mutex), several threads would produce contention, not speed.
The right choice is then to keep this phase sequential and optimize the work itself.
flowchart TD
    PLAT["wide plateau<br>in the flamegraph"]
    PLAT --> Q{"independent items ?"}
    Q -->|yes| PAR["parallelize<br>(rayon, threadpool)"]
    Q -->|no| SEQ["optimize in place<br>(algo, index, batch)"]

    style PAR fill:#e8f5e9,stroke:#388e3c
style SEQ fill:#e3f2fd,stroke:#1976d2The runtime can change what the flamegraph reveals and what you can do about it.
If csv-report were written in Python, the flamegraph would show the same plateau in the parsing loop. The temptation is to write:
from concurrent.futures import ThreadPoolExecutor
with ThreadPoolExecutor() as pool:
    results = list(pool.map(parse_and_aggregate, files))
This changes nothing for the CPU. In classic CPython, a single thread executes bytecode at a time (the GIL). The threads wait on each other: you get concurrency, not parallelism.
The remedy is ProcessPoolExecutor (separate processes, one GIL per process) or a native library that releases the GIL (pandas, polars…).
Since Python 3.14 (2025), a free-threaded build without the GIL exists (officially supported, but not yet the default, enabled via
-X gil=0):ThreadPoolExecutordoes parallelize the CPU there. Until that build is widespread, the reasoning above remains the rule.
JavaScript code runs on a single thread, the event loop.
Promise.all therefore adds no core: it interleaves tasks on that same thread. For I/O (disk reads, network), it’s perfect: the waits overlap while the CPU is free. But for pure CPU parsing, it changes nothing.
True parallelism goes through worker_threads (the equivalent of Python’s ProcessPoolExecutor). The reverse trap: if the files are on S3, the Node flamegraph will be nearly empty.
It’s time (wall > CPU) that reveals it.
If the flamegraph shows a plateau in the garbage collector (frames like runtime.gcBgMarkWorker or runtime.mallocgc), that’s not real parsing: it’s the GC triggered by the parsing’s allocations.
The treatment is different, reduce allocations rather than parallelize, but the flamegraph detects it well: the GC boxes come out wide.
The same trap on the JVM side, with a nuance: the frame names depend on the chosen garbage collector.
With G1 (the default since JDK 9), you’ll see threads like G1 Young Generation.
ZGC or Parallel GC show other frames.
Above all, a naive profiler often misses these frames (safe-point bias, see above).
A wall-clock profiler like async-profiler shows them correctly.
The method (time → flamegraph → decision) is universal. What changes between runtimes is what the flamegraph can show and what “parallelize” concretely means.
flowchart LR
    T["time<br>CPU or waiting ?"] --> F["flamegraph<br>WHERE it burns"]
    F --> Q{"splittable<br>plateau ?"}
    Q -->|yes| PAR["parallelize<br>(rayon, threads)"]
    Q -->|no| SEQ["optimize in place<br>(algo, index, batch)"]

    style F fill:#fff3e0,stroke:#e65100
    style Q fill:#e3f2fd,stroke:#1976d2
Three principles:
timebefore the profiler.user + systemfar belowrealmeans “waiting”, not “CPU”. No point opening a flamegraph for an I/O bottleneck.- The flamegraph locates, it doesn’t prescribe. It points to the wide plateaus. The what to do about it depends on what you know about the code: an independent computation parallelizes, an exclusive resource serializes.
- Profile at real scale. A test dataset that’s too small hides the bottlenecks. You need a representative volume for the plateaus to emerge.
A wide plateau can also hide more insidious traps:
- a function called millions of times with a small per-call cost
- a SQL query with a catastrophic execution plan
The flamegraph shows it wide without saying why.
The next step is to combine the flamegraph with a targeted diagnostic tool:
- a
criterionmicrobench to isolate a suspect function EXPLAIN QUERY PLANif a plateau descends into SQLstrace/dtracefor unexpected I/O
The flamegraph locates; the next tool diagnoses.